As Communications Service Providers (CSPs) worldwide scale up the deployments of their 5G networks, they face strong pressure to optimize their Return on Investment (RoI), given the massive expenses they already incurred to acquire spectrum as well as the ongoing costs of infrastructure rollouts.
DPDK Packet Capture (PDUMP)
The 16.07 release of DPDK introduces a new packet capture framework, which will allow users to capture traffic from existing devices/ports/queues and dump the packets to a pcap file. I decided to take a closer look at DPDK and the new pdump framework to see how it would leverage a packet capture/analysis environment using an XL710 NIC. I would also like to give a very high-level introduction to DPDK because in the circles that I circulate, people are really aware of what DPDK is and what it can do.
The ‘out-of-the-box experience’ wasn’t great but after I made a couple of modifications to the code base, the performance was quite good, but in reality, DPDK still lacks the fundamental features required for a capture/analysis use case. The modifications and measurements I made are described below and can also be found at https://github.com/napatech/dpdk/tree/v16.07-batching.
DPDK – A FORWARDING FRAMEWORK
DPDK, Data Plane Development Kit, is a great packet forwarding framework with high-performance library functions, that enable users to get up and running in a reasonably quick time, at acceptable or great rates of performance. With DPDK, there is however, a steep learning curve but I guess that is also the case with all the frameworks and until you get to know them and all their features, you will think life is hard. 🙂
PORTS, QUEUES, RINGS AND LCORES
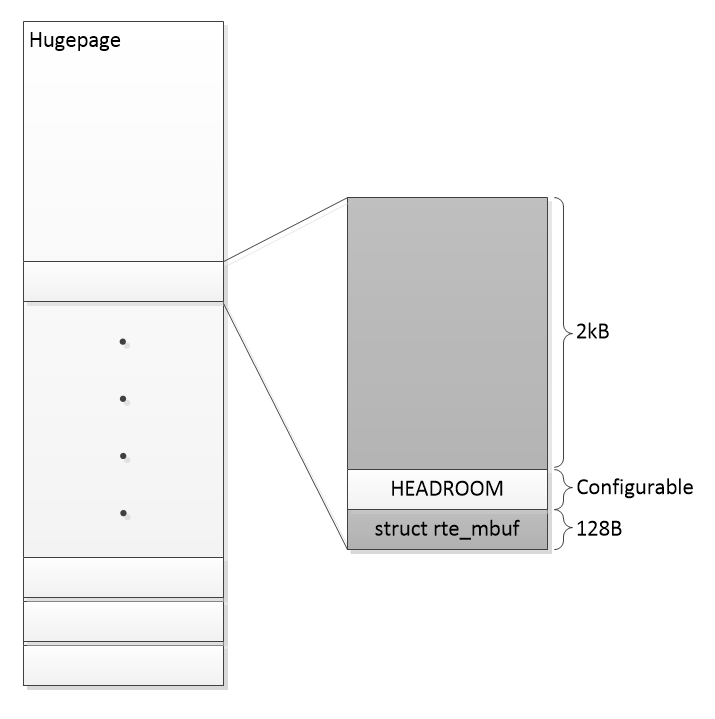
DPDK is a port-based framework. This means that each port is treated as a separate entity or device. A port can be configured with RX and TX queues and a PMD (Poll Mode Driver) abstract the enqueue/dequeue of packet buffers (rte_mbuf’s). The packet buffers (rte_mbuf) reside in huge pages to limit the amount of TLB misses and does increase performance. Huge oages uses memory pages of 2MB or 1GB where as, standard pages are 4k and every page miss is expensive. So, the bigger the pages the less misses in the translation table. DPDK uses /proc/self/pagemap to convert a virtual page address in to physical PCIe devices in order to know where to DMA to and from.
DPDK is running a while(1) loop on each lcore (logical core) which essentially is a pthread pinned to a specific CPU core.
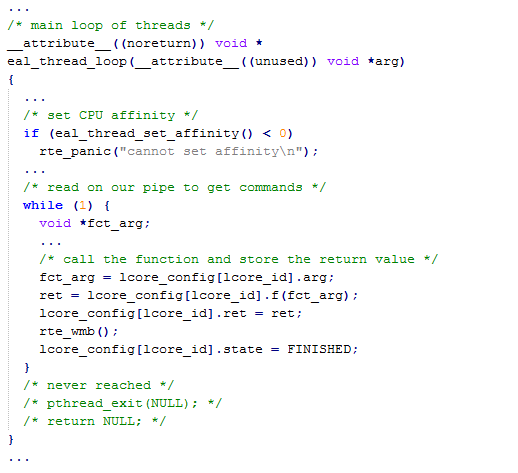
The while(1) loop checks a job queue of function pointers to perform certain operations in a run-to-completion manner and normally the most common way is to RX or TX mbufs. The functions that are registered into the job queue normally do a while(1) themselves but they don’t have to. If the application needs to send packets to another lcore, it can do so via very efficient lockless rings (they do use atomic operations which are expensive, because they need to go to last level cache) but DPDK has found ways to limit the number of atomic operations by batching the packets into arrays of mbufs, and then move batches around so the operations don’t happen per packet, instead of for e.g. 32 packets which improve performance quite a bit.
HW ACCELERATION
DPDK has support for RSS (Receive Side Scaling), hashing and protocol offsets. The acceleration has been made in a generic way by storing the offload values in the rte_mbuf structure. The rte_mbuf structure is highly optimized in size and the fields therein are carefully chosen to keep the rte_mbuf cache aligned and small, even though 128B is quite a big structure to have per packet. The PMD needs to use CPU cycles to populate the rte_mbuf with the acceleration values, but in DPDK this is almost for free because DPDK needs to touch the rte_mbuf structure anyway. So using a couple of cycles to initialize a bit more of the same cacheline wouldn’t affect performance that much. There are both pros and cons to this generic approach but the biggest con I see at the moment is that this approach makes it very difficult for PMDs to store their own proprietary acceleration features, like flow-id (packet color), packet timestamp etc. But could the HEADROOM somehow be used for that?
100% CPU USAGE IN IDLE
One of the first things a user experiences running DPDK for the first time is that it uses 100% CPU even though there are no packets to be handled. For an engineer, who spent two minutes looking at the code and documentation, this comes as no surprise because of the while(1) calling another while(1) on each lcore. For others, this is not easy to swallow especially, if they are not used to the almost zero CPU utilization that the Napatech Suite provides. DPDK has implemented a way to get by this by using interrupts so that your application can be put to sleep and be woken up when packets are received, but that is not exactly how DPDK was first envisioned, but I guess somewhere down the road somebody needed it from a power consumption point of view.
LOW LATENCY
DPDK can achieve very low latency because it completely bypasses any kernel layer and packets are DMA’ed to the rte_mbuf’s in user-space, where the PMD quickly delivers them to the receiving application and the TX path is equally fast. TX is as important in DPDK as RX because it was and still is meant to be a packet forwarding framework where packets from one port should be forwarded to another port based on some forwarding rules like what is currently being done in the OVS-DKDP project, https://software.intel.com/en-us/articles/using-open-vswitch-with-dpdk-for-inter-vm-nfv-applications. Napatech is also trying to influence this with a specialized NFV NIC built for low-latency/high-throughput and acceleration (http://www.napatech.com/solutions/).
PACKET CAPTURE – ESSENTIAL FEATURES
Packet capture at all speeds from 10Mbps to 100Gbps is Napatech’s core expertise. So I guess it is fair to say that we should know what are the essential features in that world. Applications like Tcpdump and Wireshark run on top of libpcap and can do both run-time analysis and post-analysis using the libpcpap API (live traffic or file). Packet capture appliances/applications like n2disk – http://www.ntop.org/products/traffic-recording-replay/n2disk/ can deliver libpcap formatted files, so tools like Tcpdump and Wireshark can be used for post analysis.
- Timestamp – One of the most important features in packet capture is the packet timestamp and libpcap to deliver two formats – a sec:usec and a sec:nsec, and depending on the HW these can be very precise. The sec:nsec is not a standard though, but more a Wireshark format.
- Packet ordering – Another very important feature is the packet ordering, not just on a specific port but also inter-port, which require the packets to be timestamped as close to the source (interface) as possible. This can be done either using specialized switches or specialized NICs.
- Packet merging – Applications expect to receive traffic from both uplink and downlink in the same file, which is why merging/stitching of packets is important.
- Zero packet loss is important in many use-cases.
PDUMP
Let’s see how DPDK PDUMP will handle the 4 important features mentioned above.
PACKET FLOW WITH PDUMP
The PDUMP framework introduces a rte_pdump library that runs a socket server. When a client, like the pdump application, wants to start capturing packets, the rte_pdump server registers a callback-function into the PMDs to capture from. This can be either the RX or TX PMDs or both. When packets are received by the PMD this callback is called and a copy of the packets into its own packet buffer is made and placed in a ring allowing the pdump application to retrieve them from the ring. The PDUMP can now do a dequeue of packets in an RX-ring and TX-ring and transmit those to a PCAP PMD, which is then timestamping the packets using the CPU timestamp counter (RDTSC) and writing them to a file using the libpcap function pcap_dump().
THE VERDICT
How does flow above compare to the required features.
- Timestamp – The timestamp resolution is very high but very inaccurate because the packets are timestamped just before they are written to disk and not when they were received on the port.
- Packet ordering – The packets are received/transmitted in bursts of e.g. 32 packets and it could happen that packets are actually stored in the wrong order e.g. transmit is stored before capture
- Packet merging – Packets are not merged correct simply if some jitter arises between the RX and TX queue you can end up storing TX before RX
- Zero packet loss – I was not able to achieve zero packet loss in my tests and it seems from this thread that it is because of the XL710 driver: http://dpdk.org/ml/archives/dev/2016-August/045416.html
From a capture perspective I would say the PDUMP feature fails, but again to be fair the PDUMP was never designed to be packet capture. It was designed to be a debug feature enabling users to see that traffic in their datapath, using tools like Tcpdump and Wireshark, and with that in mind the PDUMP framework might be good enough, also as mentioned in the DPDK documentation.
PERFORMANCE
The performance I got out-of-the-box writing to a /dev/null file was not very good.
The setup
I used the following setup:
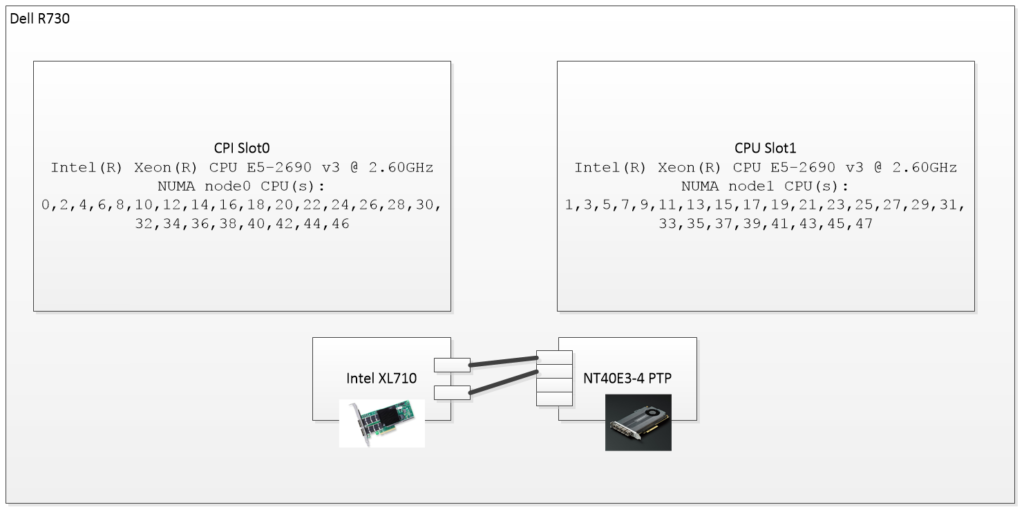
The Napatech SmartNIC, NT40E3-4-PTP
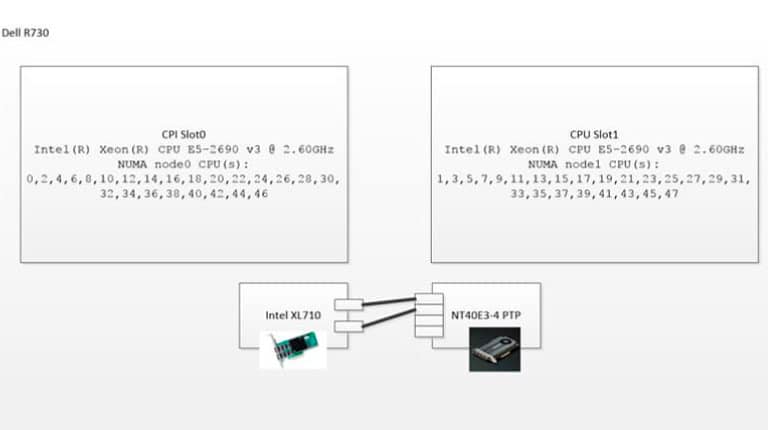
(https://www.napatech.com/support/resources/data-sheets/nt40e3-smartnic-capture/) is used as a packet generator and resides on NUMA1, so it will not influence the measurements done on NUMA0 where the XL710 (http://www.intel.com/content/www/us/en/ethernet-products/converged-network-adapters/ethernet-xl710.html) resides. The XL710 is running this firmware: f5.0.40043 a1.5 n5.04 e24c6.
The NT40E3-4-PTP SmartNIC is capable of packet generation at 4x10Gbps with close to 0 CPU utilization and two of its ports are connected to the two 10G ports on the XL710.
The traffic generators are run like:
# taskset -c 1 /opt/napatech3/bin/pktgen -N 1 -p 0 -t udp -s<pkt_size>
# taskset -c 1 /opt/napatech3/bin/pktgen -N 1 -p 1 -t udp -s<pkt_size>
Besides the pktgen tool I also use another Napatech specific tool called monitoring, which give a nice overview of the RX/TX numbers of the NT40E3-4-PTP ports.
The testmpd DPDK application is used to forward packets between the two XL710 ports. By default, the testpmd application runs in this mode and it is instructed via commandline to run on core 0,2,4,6:
# ./build/app/testpmd -c 0x55 -n 4 -- \
--nb-cores=3 --portmask=3 –socket-num=0
The dpdk-pdump application is set to capture from all queues from the PCI dev 0000:04.00.0 which is the XL710 and the application is instructed to run on core 8.
# ./build/app/dpdk-pdump -c 0x100 -n 4 -- \
--pdump device_id=0000:04:00.0,queue=*,\
rx-dev=/dev/null,tx-dev=/dev/null
Results
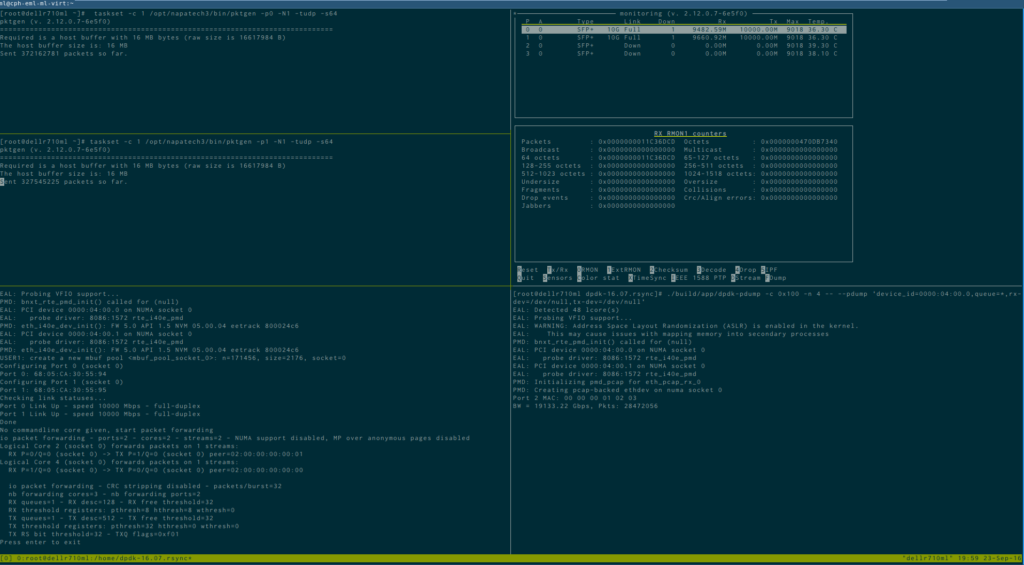
When the testpmd application is running without any pdump application attached the following forwarding speeds are achieved and show that the XL710 can almost deliver full line-rate with small packets, and it can for sure if packets are >= 256:
| Packetsize @ 2x10Gbps | testpmd fwd bandwidth on X710 |
| 64 | 2*9.8Gbps |
| 128 | 2*9.9Gbps |
| 256 | 2*10Gbps |
| 320 | 2*10Gbps |
| 384 | 2*10Gbps |
| 512 | 2*10Gbps |
Table 1, testpmd forwarding bandwidth on X710
Because the pdump framework impose a penalty on the main application, the testpmd, I think it is important to show that effect also which is why I show both the dpdk-pdump and testpmd bandwidth measurements in the following results.
OUT-OF-THE-BOX PERFORMANCE
The out-of-the-box performance writing to /dev/null is not very impressive, especially compared to a modified version of dpdk-pdump that doesn’t transmit the packets to the PCAP PMD, but instead, just touches the packets, see “pdump touch only”.
| Packetsize @ 2x10Gbps | pdump to /dev/null | testpmd fwd bandwidth on X710 |
| 64 | 6.5Gbps | 2*9.8Gbps |
| 128 | 10.4Gbps | 2*9.9Gbps |
| 256 | 13.3Gbps | 2*9.9Gbps |
| 320 | 20.0Gbps | 2*10Gbps |
| 384 | 20.0Gbps | 2*10Gbps |
| 512 | 20.0Gbps | 2*10Gbps |
Table 2, out of the box using dpdk-pdump
| Packetsize @ 2x10Gbps | pdump to /dev/null | testpmd fwd bandwidth on X710 |
| 64 | 17.3Gbps | 2*8.7Gbps |
| 128 | 19.5Gbps | 2*9.7Gbps |
| 256 | 19.9bps | 2*9.9Gbps |
| 320 | 20.0Gbps | 2*10Gbps |
| 384 | 20.0Gbps | 2*10Gbps |
| 512 | 20.0Gbps | 2*10Gbps |
Table 3, dpdk-pdump in “touch-only” mode
The results show me that the performance of testpmd is definitely affected, but also show that the write-to-disk even to /dev/null is hogging the performance. Note that the “touch only” testpmd bandwidth is dropping when pdump bandwidth increases, see 64 byte packets where testpmd drop from 2*9.2Gbps to 2*8.7Gbps, but the pdump increases from 6.5Gbps to 17.3Gbps. The reason for this is that when writing-to-disk then testpmd most of the time discards, which is cheaper than actually forwarding them.
IMPROVEMENTS TO DPDK PDUMP
Based on the oabove measurements, I thought that it should be possible to make some enhancements. So I started investigating the bottlenecks in the current implementation and was able to get a significant boost of performance without sacrificing functionality.
Improvements to DPDK PDUMP
Based on the out of the box measurements I thought that it should be possible to make some enhancements so I started investigating the bottlenecks in the current implementation and was able to get a significant boost of performance without sacrificing functionality.
BUFFERED WRITE
The most obvious bottleneck was in the pcap_dump() function within libpcap and actually the problem should be fixed within libpcap if you ask me, but I fixed it in DPDK temporally. Basically the pcap_dump() function does a fwrite(pcap header of 16Bytes) followed by a fwrite(packet payload) and these two fwrite(s) cause two kernel traps, which are expensive and should be minimized. The solution is to buffer the output to file and write seldom but more data at every write, so in essence do:
if (buffer has room) do
memcpy header and payload to buffer
else
fwrite buffer
The small improvement above gave the following results:
| Packetsize @ 2x10Gbps | pdump to /dev/null | testpmd fwd bandwidth on X710 |
| 64 | 13.9Gbps | 2*7.2Gbps |
| 128 | 19.3Gbps | 2*9.7Gbps |
| 256 | 19.9bps | 2*9.9Gbps |
| 320 | 20.0Gbps | 2*10Gbps |
| 384 | 20.0Gbps | 2*10Gbps |
| 512 | 20.0Gbps | 2*10Gbps |
Table 4, improvements using buffered write
CONTIGUOUS BATCHING
The contiguous batching will in DPDK ensure that as many packets as possible are memcpy’ed back-to-back in the same rte_mbuf. A standard rte_mbuf has 2048k packet space and within that I can fit ~20 64 byte packets where each packet contains a header + payload and the header has enough information to reconstruct the real rte_mbuf header, if needed.
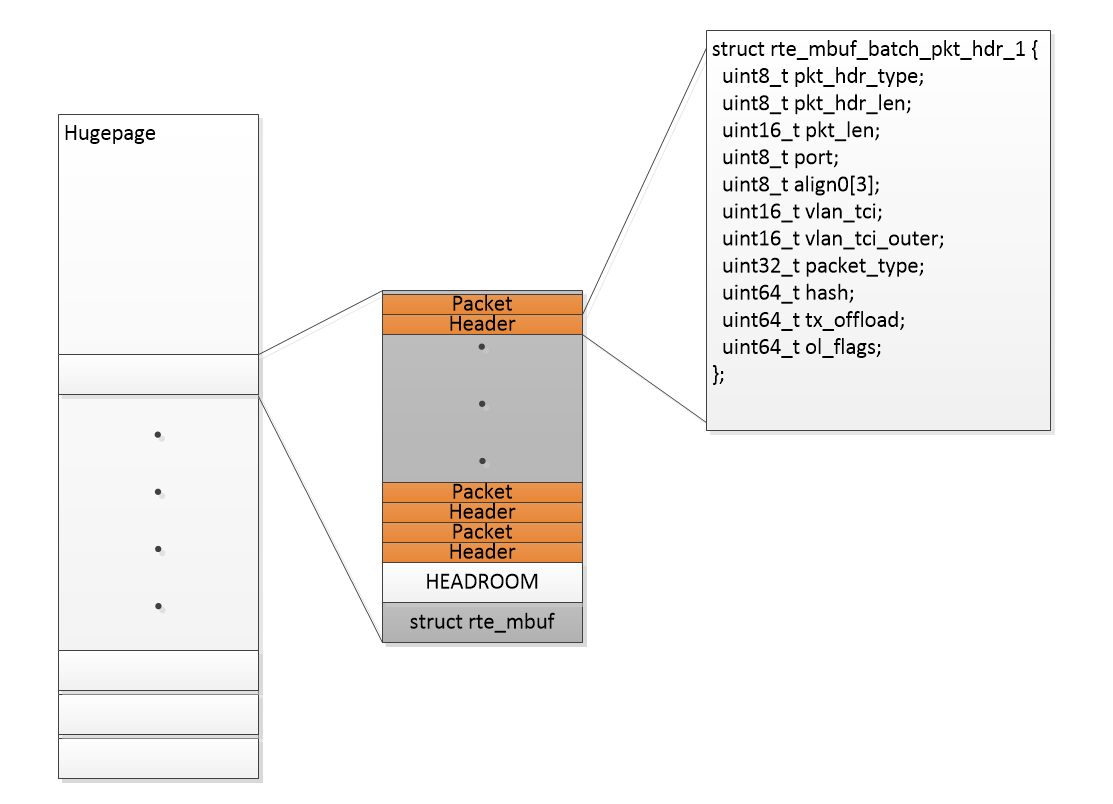
The performance I got using contiguous batching and the buffered write from before is now:
| Packetsize @ 2x10Gbps | pdump to /dev/null | testpmd fwd bandwidth on X710 |
| 64 | 19.1Gbps | 2*9.5Gbps |
| 128 | 19.6Gbps | 2*9.8Gbps |
| 256 | 20.0bps | 2*10Gbps |
| 320 | 20.0Gbps | 2*10Gbps |
| 384 | 20.0Gbps | 2*10Gbps |
| 512 | 20.0Gbps | 2*10Gbps |
Table 5, dpdk-pdump to /dev/null with batching and buffered write
| Packetsize @ 2x10Gbps | pdump to /dev/null | testpmd fwd bandwidth on X710 |
| 64 | 19.1Gbps | 2*9.5Gbps |
| 128 | 19.6Gbps | 2*9.8Gbps |
| 256 | 20.0bps | 2*10Gbps |
| 320 | 20.0Gbps | 2*10Gbps |
| 384 | 20.0Gbps | 2*10Gbps |
| 512 | 20.0Gbps | 2*10Gbps |
Table 6, dpdk-pdump in “touch-only” mode with batching support
The performance is now improved quite a bit, from 17.3Gbps to 19.1Gbps in “touch-only” mode and from 13.9Gbps to 19.1Gbps when writing to /dev/null but mostly for packets < 256B. It is important to see that not only the pdump throughput has been improved, but also the work burden on testpmd has been lifted. So I would say the contiguous batching is a win-win solution if applied correctly. I wouldn’t say it is the holy grail but it works perfectly for some use cases and can be applied to DPDK in a generic manner, so that the application can just check a flag in the rte_mbuf structure, to see if the buffer consists of one or multiple packets?
NEXT STEPS
One big problem with the current PDUMP implementation, as I see it, is that packets are timestamped too late. To enable DPDK in a capture/analysis environment, I would like to see the timestamping being a generic part of DPDK and that packets are timestamped inside the receiving PMD or at least in rte_pdump, if the timestamping penalty shouldn’t affect the normal DPDK use cases because the RDTSC read out is not cheap. Today, DPDK doesn’t even support RX timestamping. If applications need timestamping they must do it when the application receives the packet using the RDTSC or gettimeofday(), but since DPDK has low latency, this might work for some applications. If packets were timestamped at the port level and if timestamping were to be a generic part of DPDK it will also enable merging of packets from multiple ports correctly to the same destination file.The buffered write and the batching could also be improved. I could see in the solution where the pdump application that registers itself into the rte_pdump framework instructs, that it requires packets to be delivered in pcap format and then the rte_pdump framework will batch packets together in pcap format instead of the generic format.I’m not sure the stuff above will ever find its way to DPDK because they are very capture/analysis savvy and DPDK is a forwarding kit. So until then, I guess the Napatech API (NTAPI) is still preferred for those purposes.


